> ## Documentation Index
> Fetch the complete documentation index at: https://docs.safaridesk.io/llms.txt
> Use this file to discover all available pages before exploring further.
# SafariDesk Dashboard – Helpdesk Overview & Queue Management
> Learn how to use the SafariDesk dashboard to monitor ticket volume, queue health, agent workload, and SLA compliance in real-time.
## Overview
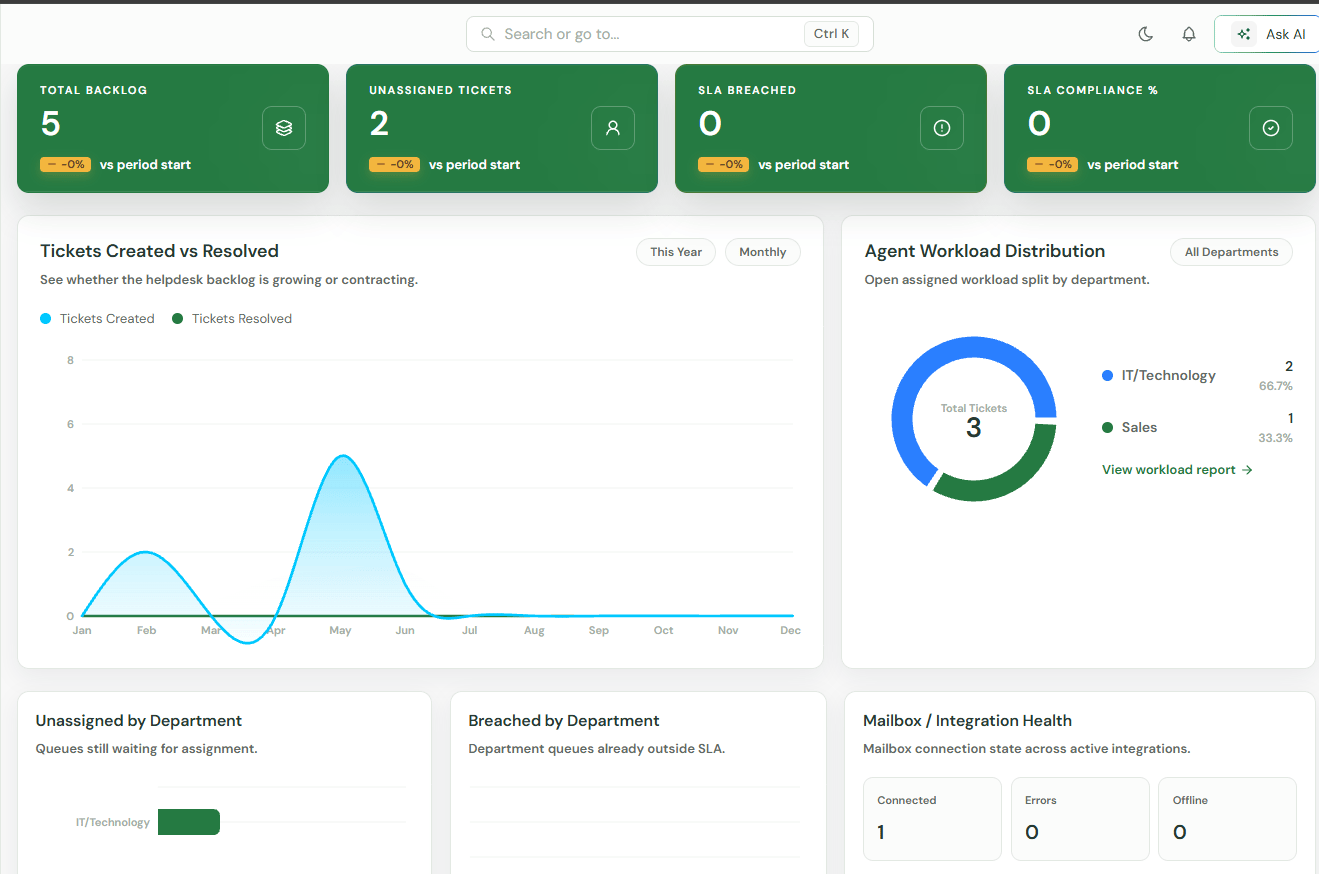
The Dashboard provides a real-time overview of your helpdesk operations, allowing admins and team leads to monitor bottlenecks, track performance, and ensure no customer request falls through the cracks.
### Filter by Time
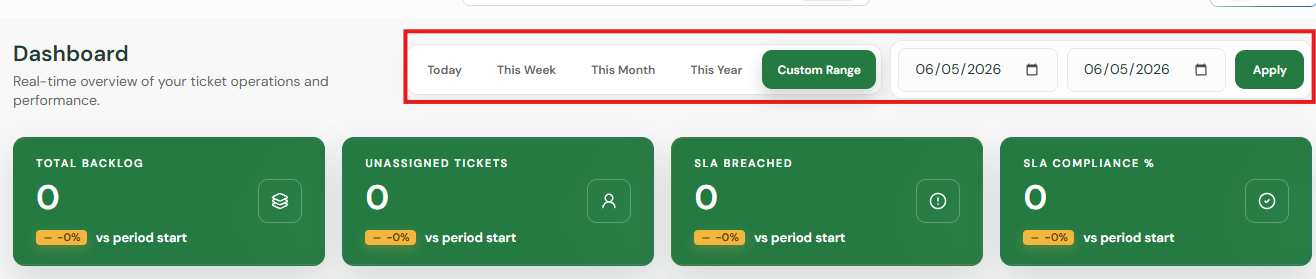
Use the quick-filter buttons or the date picker at the top right of the dashboard to adjust the reporting window. Clicking **Apply** updates all metrics instantly.
* **Presets:** Today, This Week, This Month, This Year
* **Custom Range:** Select specific start and end dates to analyze precise historical windows.
 ### Filter by Time
Use the quick-filter buttons or the date picker at the top right of the dashboard to adjust the reporting window. Clicking **Apply** updates all metrics instantly.
* **Presets:** *Today, This Week, This Month, This Year*
* **Custom Range:** Select specific start and end dates to analyze precise historical windows.
### Filter by Time
Use the quick-filter buttons or the date picker at the top right of the dashboard to adjust the reporting window. Clicking **Apply** updates all metrics instantly.
* **Presets:** *Today, This Week, This Month, This Year*
* **Custom Range:** Select specific start and end dates to analyze precise historical windows.
 ## Visual Trends & Analytics
#### Tickets Created vs Resolved
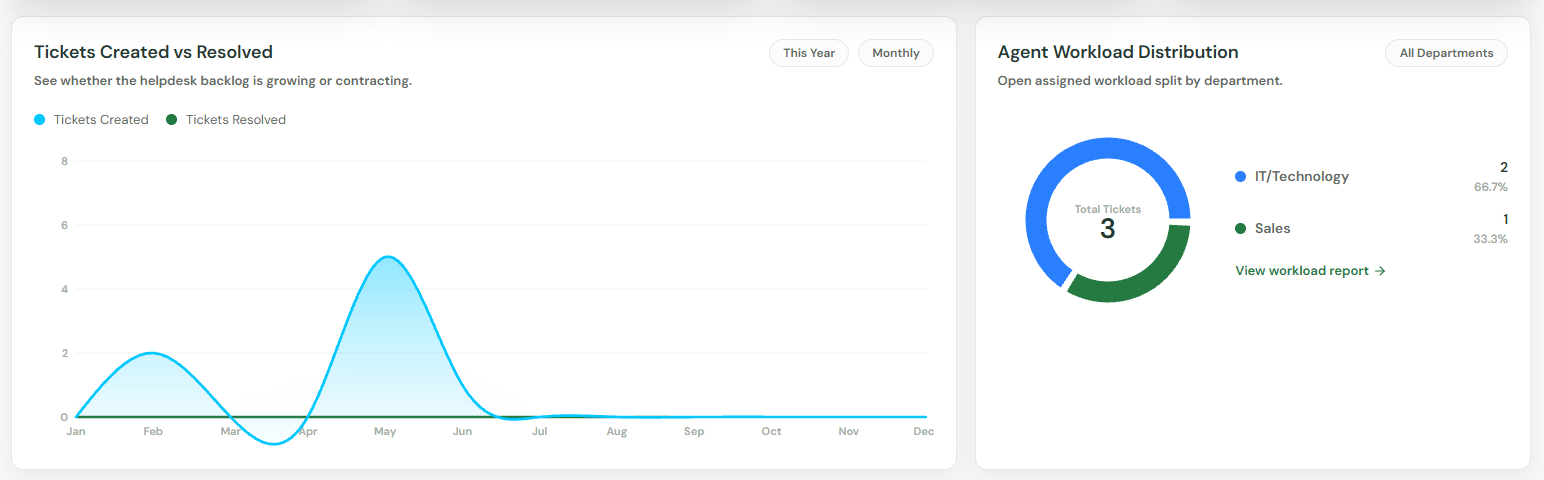
A dual-line chart tracking helpdesk volume over time. This metric visually displays whether your backlog is growing or contracting by comparing new incoming tickets against closed ones.
## Visual Trends & Analytics
#### Tickets Created vs Resolved
A dual-line chart tracking helpdesk volume over time. This metric visually displays whether your backlog is growing or contracting by comparing new incoming tickets against closed ones.
 #### CSAT & Reopened Ticket Trends
* **Average CSAT:** Real-time tracking of your customer satisfaction scores.
* **Total Reopened:** Monitors the volume of tickets that required follow-up after initial closure, helping you identify resolution quality issues.
Queue Health & Workload Distribution
#### Agent Workload Distribution
Displays the split of open assigned workloads across your entire team. You can filter this view by specific departments or click **View workload report** for individual agent deep dives.
#### Breakdown by Department
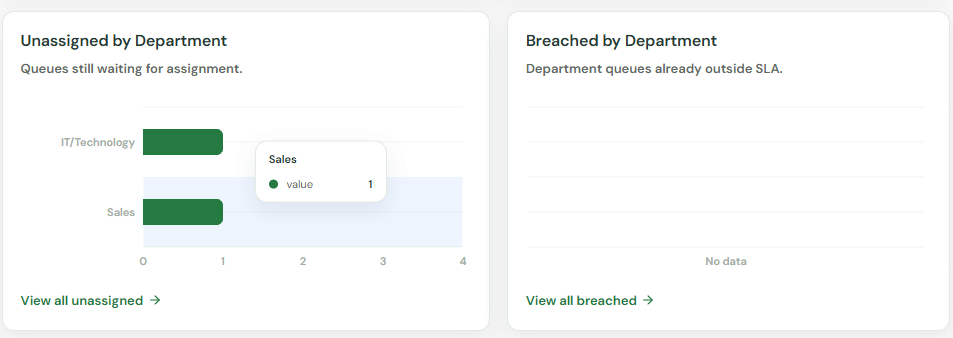
Three dedicated monitoring charts break down your operational blind spots by department:
* **Unassigned by Department:** See which queues are falling behind on ownership.
* **Breached by Department:** Identify departments struggling to maintain SLA compliance.
* **Top Slow Categories:** Ranks your most sluggish queues by average resolution time.
#### CSAT & Reopened Ticket Trends
* **Average CSAT:** Real-time tracking of your customer satisfaction scores.
* **Total Reopened:** Monitors the volume of tickets that required follow-up after initial closure, helping you identify resolution quality issues.
Queue Health & Workload Distribution
#### Agent Workload Distribution
Displays the split of open assigned workloads across your entire team. You can filter this view by specific departments or click **View workload report** for individual agent deep dives.
#### Breakdown by Department
Three dedicated monitoring charts break down your operational blind spots by department:
* **Unassigned by Department:** See which queues are falling behind on ownership.
* **Breached by Department:** Identify departments struggling to maintain SLA compliance.
* **Top Slow Categories:** Ranks your most sluggish queues by average resolution time.
 ### Integrations & Operational Guardrails
#### Mailbox / Integration Health
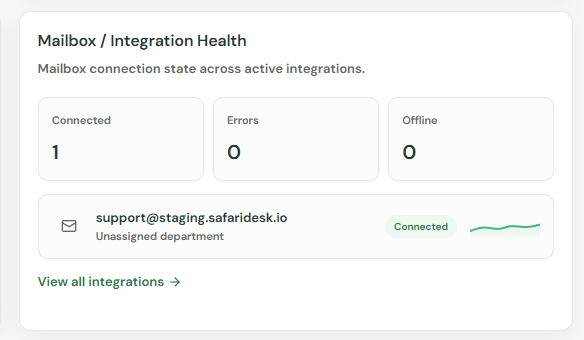
Provides the exact connection state across all active email integrations (e.g., `support@staging.safaridesk.io`). Displays green for **Connected**, along with clear indicators for **Errors** or **Offline** status to prevent dropped tickets.
### Integrations & Operational Guardrails
#### Mailbox / Integration Health
Provides the exact connection state across all active email integrations (e.g., `support@staging.safaridesk.io`). Displays green for **Connected**, along with clear indicators for **Errors** or **Offline** status to prevent dropped tickets.
 #### Ticket Blockers & Alerts
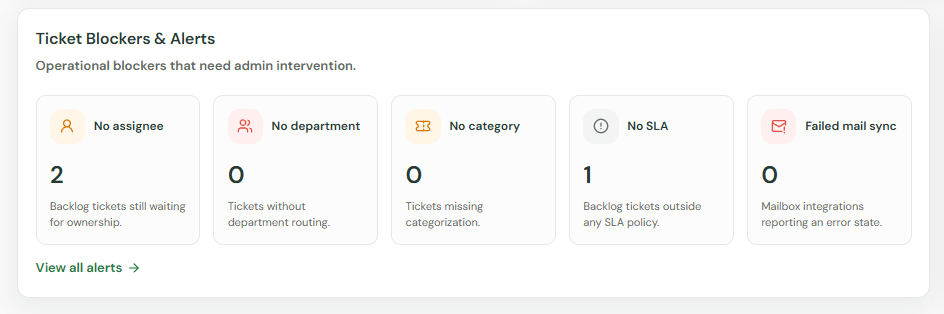
An automated checklist highlighting missing configuration items that require admin intervention. It tracks unrouted or unmanaged tickets including:
* No assignee & No department
* No category & No SLA policy
* Failed mail syncs
#### Ticket Blockers & Alerts
An automated checklist highlighting missing configuration items that require admin intervention. It tracks unrouted or unmanaged tickets including:
* No assignee & No department
* No category & No SLA policy
* Failed mail syncs
 #### At-Risk Agents
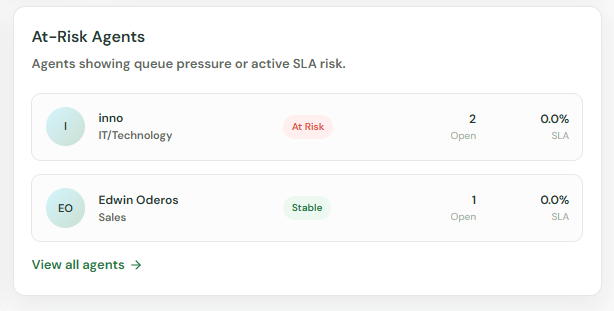
Automatically flags individual agents who are currently showing high queue pressure or active SLA risk, giving managers a clear indicator of where to redistribute workload.
#### At-Risk Agents
Automatically flags individual agents who are currently showing high queue pressure or active SLA risk, giving managers a clear indicator of where to redistribute workload.