
Overview
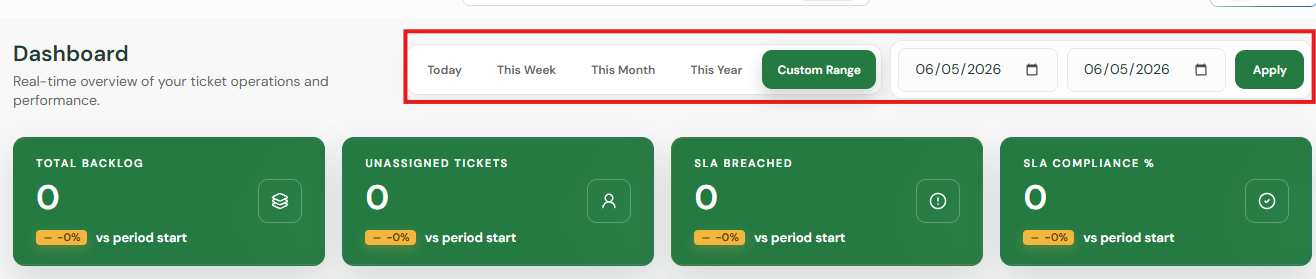
The Dashboard provides a real-time overview of your helpdesk operations, allowing admins and team leads to monitor bottlenecks, track performance, and ensure no customer request falls through the cracks.Filter by Time
Use the quick-filter buttons or the date picker at the top right of the dashboard to adjust the reporting window. Clicking Apply updates all metrics instantly.- Presets: Today, This Week, This Month, This Year
- Custom Range: Select specific start and end dates to analyze precise historical windows.
Filter by Time
Use the quick-filter buttons or the date picker at the top right of the dashboard to adjust the reporting window. Clicking Apply updates all metrics instantly.- Presets: Today, This Week, This Month, This Year
- Custom Range: Select specific start and end dates to analyze precise historical windows.
Visual Trends & Analytics
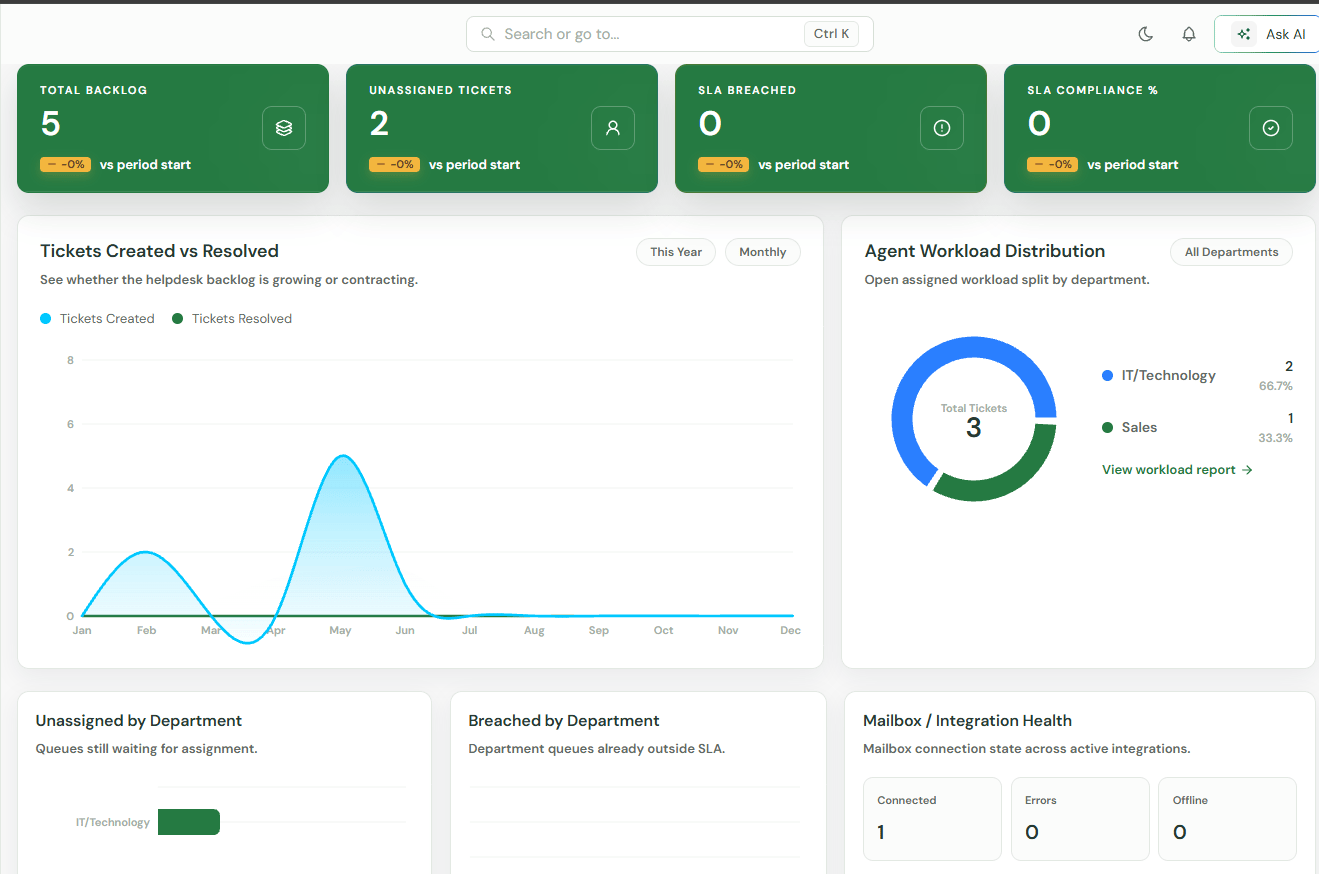
Tickets Created vs Resolved
A dual-line chart tracking helpdesk volume over time. This metric visually displays whether your backlog is growing or contracting by comparing new incoming tickets against closed ones.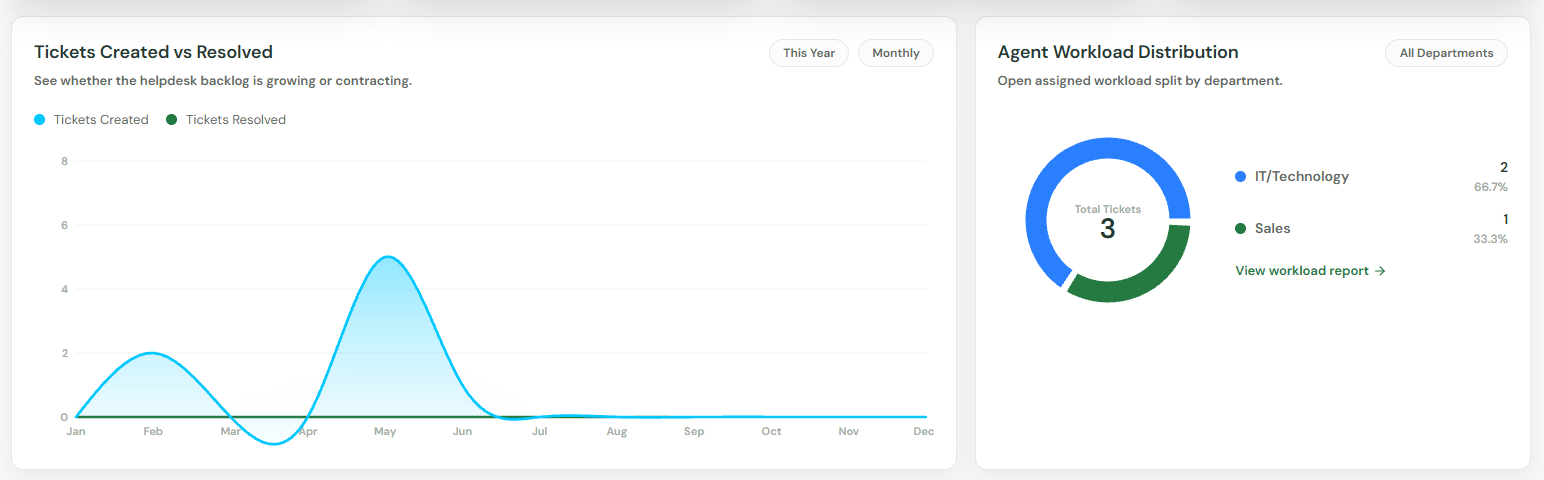
CSAT & Reopened Ticket Trends
- Average CSAT: Real-time tracking of your customer satisfaction scores.
- Total Reopened: Monitors the volume of tickets that required follow-up after initial closure, helping you identify resolution quality issues.
Agent Workload Distribution
Displays the split of open assigned workloads across your entire team. You can filter this view by specific departments or click View workload report for individual agent deep dives.Breakdown by Department
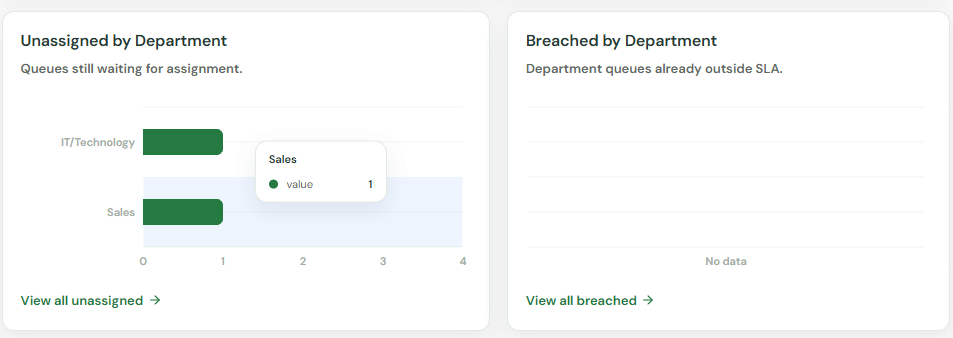
Three dedicated monitoring charts break down your operational blind spots by department:- Unassigned by Department: See which queues are falling behind on ownership.
- Breached by Department: Identify departments struggling to maintain SLA compliance.
- Top Slow Categories: Ranks your most sluggish queues by average resolution time.
Integrations & Operational Guardrails
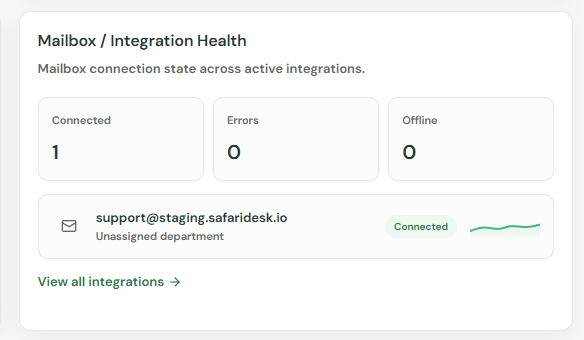
Mailbox / Integration Health
Provides the exact connection state across all active email integrations (e.g.,[email protected]). Displays green for Connected, along with clear indicators for Errors or Offline status to prevent dropped tickets.
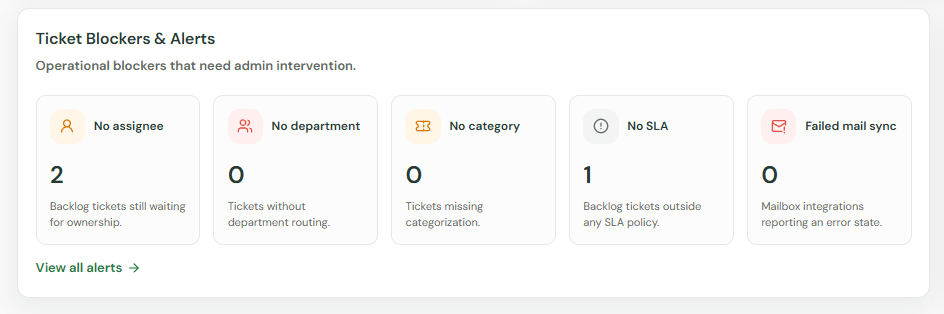
Ticket Blockers & Alerts
An automated checklist highlighting missing configuration items that require admin intervention. It tracks unrouted or unmanaged tickets including:- No assignee & No department
- No category & No SLA policy
- Failed mail syncs
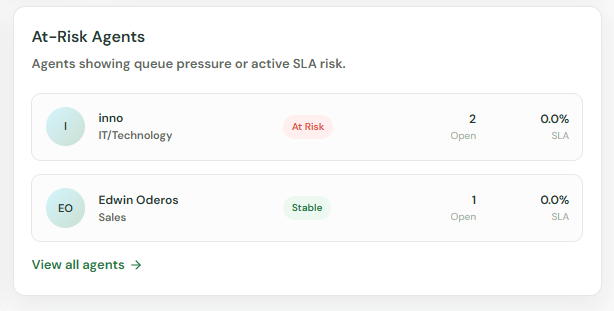
At-Risk Agents
Automatically flags individual agents who are currently showing high queue pressure or active SLA risk, giving managers a clear indicator of where to redistribute workload.